Application of Acrel-2000 Power Monitoring System in Phase II Commercial Building of Block C12 in Baoli New Town, Jiading New Town
2023-09-07 15:11:20
Introduce the second phase commercial building of Block C12 in Jiali New Town, Baoli New Town, using intelligent power meters to collect various electrical parameters and switching signals from the power distribution site. The system adopts the on-site local networking mode. After networking, it communicates through the fieldbus and travels to the background. Through the Acrel-2000 power monitoring and power management system, the real-time monitoring and management of the power distribution circuit of the substation is realized.
Yang Junjun
Ankerui Electric Co., Ltd., Jiading, Shanghai 201801, China;
0 Overview
Shanghai Haijiading invested about 1.6 billion yuan to build the first tourism commercial real estate project - "Taipei Fashion Street", which will be divided into six major formats, all of which will attract Taiwanese brands. Located in the C12 plot of Poly Home, Taipei Fashion Street is a characteristic commercial street built by Poly Real Estate. It has two floors underground and seven floors above ground. The total commercial building area is about 105,000 square meters, including boutique commercial, entertainment, catering and comprehensive. Office and other formats.
The total construction area of ​​the second phase commercial housing project of Jiading New Town Baoli Homestead C12 is 128,489 square meters. The main building is 5 floors above ground and 2 underground floors. The local high-rise is 10 floors above ground, 2 underground floors and 23.200 meters of multi-storey buildings. Part of the 41.750 meters, the aboveground part is used for commercial, cultural and sports, and the underground part is used for commercial, garage and equipment;
This project is a power monitoring system designed for the high and low voltage power distribution and distribution of Jiali New Town Baoli Home.
1 Demand analysis
There are three power distribution rooms on the site, namely 1# transformer room (10KV part and 0.4KV part), 2# power distribution room (0.4KV part), 35KV transformer room (10KV part and 35KV part). Power monitoring systems need to implement centralized data management, analysis and processing. The approximate functional requirements of the software are as follows:
Monitoring information such as voltage, current, power, power factor and frequency is refreshed in real time and displayed visually and dynamically in a single graph. The information of each electrical parameter, circuit name, and current limit of the circuit is displayed on each circuit sub-screen.
A trend curve is drawn for the current of each loop to facilitate analysis of the distribution operation conditions of the loop.
The power collection function of each loop can generate power consumption reports that meet customer management requirements during the time period.
10KV high voltage opening and closing operation.
This technical condition applies to the power distribution room of the second phase commercial building of Block C12 in Jiali New Town. Supplier products should be highly safe and reliable, easy to expand, and easy to maintain and maintain. The products provided by the supplier shall meet at least the technical conditions, but not limited to this, and its technical performance shall meet the requirements for data monitoring of the power distribution room.
2 system plan
The monitoring system mainly realizes power consumption monitoring and power management for the second-phase commercial house transformer distribution in the C12 block of Jiading New Town. The monitoring scope is 1# transformer substation T1, T2, T3, T4, T7, T8 transformer low-voltage incoming line cabinet, communication cabinet, feeder cabinet instrument, 10KV partial integrated protection device; 2# distribution station T5, T6 transformer Low-voltage inlet cabinet, communication cabinet, feeder cabinet instrument; 35KV substation 10KV integrated protection device, 35KV integrated protection device for remote real-time monitoring and power management. The system is connected to 198 multi-function power meters of 1# substation, divided into 7 buses, 10 integrated protection devices, divided into 2 buses, and the bus directly accesses the acquisition equipment in the substation; access to 2# substation 164 Only multi-function power meter, divided into 6 buses, the bus directly connects to the acquisition equipment in the substation; access to 13 integrated protection devices of 35KV substation, divided into 5 buses, the duty room is located next to the 35KV substation, the bus directly Access to the indoor collection equipment on duty, 1# substation, 2# substation collection equipment uploads data to the duty room host through optical fiber, so as to realize the data connection between the instrument on the bus and the monitoring host on the monitoring host. As shown in the figure below: station management layer, network communication layer and field device layer.
.jpg)
System network topology
1) Station management
The management of the station control management system for the power monitoring system is a direct window for human-computer interaction. In the main refers to the industrial computer, display, UPS, etc. placed in the duty room.
2) Network communication layer
The communication layer is mainly composed of NPORT5610-8 (16) serial server, Ethernet device and bus network. The main function of NPORT5610-8(16) serial server is to monitor on-site intelligent instrument and comprehensive protection device; the main function of Ethernet device and bus network is to realize data interaction, make distribution system management centralized, information and intelligent. Improve the safety, reliability and stability of the power distribution system, and truly achieve the goal of unattended.
3) Field device layer
The field device layer is a data acquisition terminal, which is mainly composed of a smart meter and an integrated protection device. The smart meter is connected to the communication server through a shielded twisted pair RS485 interface, and uses a MODBUS communication protocol bus type connection to reach the distribution room monitoring host via the communication server. Networking for remote control.
Smart meter field connection
The field instrument is connected by hand-shielded through the shielded twisted pair (RVVSP2*1.0). The number of smart meters connected to each bus is about 20, and then the data is uploaded to the serial port server NPORT5610-8 (16), and the data is uploaded. Go to the local monitoring terminal. The specific connection diagram is as follows:
.jpg)
The low-voltage incoming and feeder loops use multi-function meters that measure all conventional power parameters such as three-phase voltage, current, power factor, frequency, active energy, and reactive energy.
3 system function
Features
The system adopts full Chinese interface, and the operation is simple and convenient; the operation is stable and reliable; the system has a system diagram display, simulation diagram display and network structure diagram display; the system provides a friendly human-computer interaction interface, and all operations can be performed on the interface. And has a remote display function.
login interface
In order to ensure the safe and stable operation of the system, the user rights management function is set. Unauthorized operations (such as power distribution loop name modification, etc.) can be prevented by user rights management. Define the login name, password, and operation authority of users of different levels to provide reliable security for system operation and maintenance management. The user's level is divided into three levels: operator, engineer, and system administrator. Each level can be assigned to different operation rights, including entering operation, exiting operation, remote operation, and report management. The system administrator is the highest level user, and the higher level user can add and delete the next level of users.
.jpg)
The monitoring system interface is divided into three parts, the title interface, the power distribution system interface and the menu switching interface.
.jpg)
The current time of the currently logged in user and system is displayed in the title interface.
The system interface displays various parameters corresponding to the current interface.
.jpg)
The buttons arranged on the menu switching interface are the function switching buttons of the system. Different function buttons can enter the corresponding function interface.
High pressure system monitoring
.jpg)
High voltage system monitoring interface
The three-phase voltage, current and power isoelectric parameters under high voltage conditions can be observed through the interface. There are “close†and “open†buttons on the interface. If it is in the "closed" state, the closing button is prohibited. At this time, if you need to open the door, click the "open" button, enter the password, you can open the door remotely. If it is in the "open" state, the opening button is prohibited. At this time, if you need to close the switch, click the “Close†button and enter the password to open the switch remotely.
Low voltage system monitoring
.jpg)
Low voltage switching window
.jpg)
Low pressure system diagram
This interface can observe the real-time running status of the incoming cabinet and each outlet cabinet.
.jpg)
Detailed parameter interface
In the "Detailed Parameters" window, you can view the distribution and connection of each distribution circuit as well as the main electrical parameters. The main data includes: three-phase current, three-phase voltage, power of the incoming loop, power, power factor, circuit name, and current and circuit name of the outgoing loop.
When you choose to log in to the system as “Administratorâ€, you can click the loop name in the system map to modify the loop name directly. After the modification, the system will automatically save it. In the system diagram, the on/off of each loop will be indicated by a red-green switch. Red indicates that the loop is on and green indicates that the loop is open.
Communication status
The real-time display of the communication status of each device in the access system can completely display the entire system network structure, and can diagnose the network communication status of the system online. When a network failure occurs, the fault unit and the fault location can be automatically displayed on the screen. Therefore, the system maintenance personnel can grasp the communication status of each device in the real-time, and timely maintain the abnormal equipment to ensure the stable operation of the system.
.jpg)
Communication status map
This interface is the communication state of the high voltage circuit diagram. Click on the "to 1# substation" and to the "2# substation" arrow to enter the substation low voltage system. At the same time, you can see the distributed network structure. If the loop communication is normal, it will be red, otherwise it will be green.
Electrical parameter report
Real-time power parameters and historical power parameters storage and management functions, all real-time data collected, sequential event records, etc. can be saved to the real-time database. In the monitoring screen, you can customize the parameters that need to be queried, the time period of the query, or select the number of records that have been updated recently, and display them in a report mode. This feature makes it easy for users to conduct accident tracking queries.
.jpg)
Electric parameter report function
Set the time you need to query, click the Query button to query the electrical parameter report of each loop at a certain time in history. The main data includes: three-phase voltage, three-phase current, active power, reactive power, power compensation factor, and electrical energy.
This report contains all the loops. Help users to understand whether voltage instability, current limit, power and power factor meet the requirements during system operation. Based on this, the system is better managed and optimized.
Reports can be exported as a spreadsheet with print capabilities. Click Print Report to print the report as needed.
Energy report
The integrity of the measurement system is reflected in a rich data report. The system has the function of counting and counting the periodic meter reading of each loop. The user can freely query the power consumption of each power distribution node in any time period since the normal operation of the system, that is, the statistical analysis of the power consumption of the incoming line of the node and the power consumption of each branch circuit. Report. This function makes the electricity use visible and transparent, and can be traced when the power consumption error is too large to maintain the correctness of the measurement system.
.jpg)
Energy report function
The management of power consumption is presented in the form of a report. The report can display the power consumption of each loop in any period of time during the system operation. Each incoming loop and its outgoing loop are made in a table, which is convenient for querying. .
By adjusting the start time and end time, you can display the power consumption during this time period.
The report can be exported as a spreadsheet with print capabilities.
Current curve
A current potential curve is designed for the total incoming line of the distribution system (or the exit of the critical load). It is convenient for distribution and maintenance personnel to keep abreast of the demand of power consumption and the load of power supply system to ensure the reliability of power supply and provide guarantee for the energy use rights of user units. With this function, it is also possible to analyze the growth trend of energy demand, adjust the demand declaration in a timely manner, and reduce the excess payment due to excessive deviation of demand.
.jpg)
Current curve function
The X axis of the curve chart represents the time span, the Y axis represents the range, and the corresponding loop refresh curve is selected to display the historical curve display of the selected circuit for one day and seven days;
The current curve helps the user to perform power quality analysis and fault analysis.
Alarms and events
Real-time alarm
The real-time alarm window monitors the telemetry collected by the system. The alarm window opens automatically when the system is running and remains hidden in the background.
When there is current or voltage limit and the alarm limit is reached, the “Real-time real-time alarm†window will pop up automatically, and the specific alarm information will be displayed in red font: loop name, over-limit electric parameter, alarm value, etc.
Historical alarm
By adjusting the start time and end time, you can query the system alarm information in any past time period, including telemetry alarm and remote alarm, including the specific alarm time, alarm type, alarm content and so on.
System event
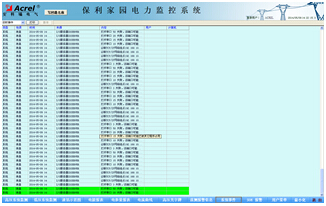
System event query function
In this interface, select “Real-time events†to view the operation status of each part of the system in the current state, and select “Event Query†to query the operation at any time.
High-pressure light plate
With high-voltage loop light card display function. This function can display the status of the on-site circuit breaker, grounding knife, circuit breaker trolley and related faults and alarm signals in real time, so that the distribution maintenance personnel can grasp the working status of the power distribution system in time.
.jpg)
High-pressure light plate
4 Conclusion
In today's power distribution facilities, the distribution security of the substation is of vital importance. The application of the Acrel-2000 power monitoring system described in this paper at No. 200 Tianlin Road can realize the power supply to the substation power supply and distribution circuit. The real-time monitoring can not only display the power consumption of the loop, but also have the network communication function, and can form a power monitoring system with the serial port server and the computer. The system realizes the analysis and processing of the collected data, displays the running status of each distribution circuit in the substation in real time, and has a pop-up alarm dialog box, voice prompt, SMS alarm light for the closing and closing of the load, and generates various energy reports. Analyze curves, graphs, etc., to facilitate remote meter reading and analysis and research of electric energy. The system is safe, reliable and stable, providing a real and reliable basis for the factory to solve the problem of electricity consumption, and has achieved good business benefits.
references:
[1]. Ren Zhicheng Zhou Zhong. Principles and Application Guidelines of Power Electrical Measurement Digital Instrumentation [M]. Beijing. China Electric Power Press. 2007. 4
[2]. Zhou Zhongbian. Smart grid customer power monitoring and power management system product selection and solution [M]. Beijing. Mechanical Industry Press. 2011.10
About the author: Yang Junjun, female, undergraduate. Position: Now working for Ankerui Electric Co., Ltd., contact number, mobile phone, QQ
Http://news.chinawj.com.cn Editor: (Hardware Business Network Information Center) http://news.chinawj.com.cn
Yang Junjun
Ankerui Electric Co., Ltd., Jiading, Shanghai 201801, China;
0 Overview
Shanghai Haijiading invested about 1.6 billion yuan to build the first tourism commercial real estate project - "Taipei Fashion Street", which will be divided into six major formats, all of which will attract Taiwanese brands. Located in the C12 plot of Poly Home, Taipei Fashion Street is a characteristic commercial street built by Poly Real Estate. It has two floors underground and seven floors above ground. The total commercial building area is about 105,000 square meters, including boutique commercial, entertainment, catering and comprehensive. Office and other formats.
The total construction area of ​​the second phase commercial housing project of Jiading New Town Baoli Homestead C12 is 128,489 square meters. The main building is 5 floors above ground and 2 underground floors. The local high-rise is 10 floors above ground, 2 underground floors and 23.200 meters of multi-storey buildings. Part of the 41.750 meters, the aboveground part is used for commercial, cultural and sports, and the underground part is used for commercial, garage and equipment;
This project is a power monitoring system designed for the high and low voltage power distribution and distribution of Jiali New Town Baoli Home.
1 Demand analysis
There are three power distribution rooms on the site, namely 1# transformer room (10KV part and 0.4KV part), 2# power distribution room (0.4KV part), 35KV transformer room (10KV part and 35KV part). Power monitoring systems need to implement centralized data management, analysis and processing. The approximate functional requirements of the software are as follows:
Monitoring information such as voltage, current, power, power factor and frequency is refreshed in real time and displayed visually and dynamically in a single graph. The information of each electrical parameter, circuit name, and current limit of the circuit is displayed on each circuit sub-screen.
A trend curve is drawn for the current of each loop to facilitate analysis of the distribution operation conditions of the loop.
The power collection function of each loop can generate power consumption reports that meet customer management requirements during the time period.
10KV high voltage opening and closing operation.
This technical condition applies to the power distribution room of the second phase commercial building of Block C12 in Jiali New Town. Supplier products should be highly safe and reliable, easy to expand, and easy to maintain and maintain. The products provided by the supplier shall meet at least the technical conditions, but not limited to this, and its technical performance shall meet the requirements for data monitoring of the power distribution room.
2 system plan
The monitoring system mainly realizes power consumption monitoring and power management for the second-phase commercial house transformer distribution in the C12 block of Jiading New Town. The monitoring scope is 1# transformer substation T1, T2, T3, T4, T7, T8 transformer low-voltage incoming line cabinet, communication cabinet, feeder cabinet instrument, 10KV partial integrated protection device; 2# distribution station T5, T6 transformer Low-voltage inlet cabinet, communication cabinet, feeder cabinet instrument; 35KV substation 10KV integrated protection device, 35KV integrated protection device for remote real-time monitoring and power management. The system is connected to 198 multi-function power meters of 1# substation, divided into 7 buses, 10 integrated protection devices, divided into 2 buses, and the bus directly accesses the acquisition equipment in the substation; access to 2# substation 164 Only multi-function power meter, divided into 6 buses, the bus directly connects to the acquisition equipment in the substation; access to 13 integrated protection devices of 35KV substation, divided into 5 buses, the duty room is located next to the 35KV substation, the bus directly Access to the indoor collection equipment on duty, 1# substation, 2# substation collection equipment uploads data to the duty room host through optical fiber, so as to realize the data connection between the instrument on the bus and the monitoring host on the monitoring host. As shown in the figure below: station management layer, network communication layer and field device layer.
System network topology
1) Station management
The management of the station control management system for the power monitoring system is a direct window for human-computer interaction. In the main refers to the industrial computer, display, UPS, etc. placed in the duty room.
2) Network communication layer
The communication layer is mainly composed of NPORT5610-8 (16) serial server, Ethernet device and bus network. The main function of NPORT5610-8(16) serial server is to monitor on-site intelligent instrument and comprehensive protection device; the main function of Ethernet device and bus network is to realize data interaction, make distribution system management centralized, information and intelligent. Improve the safety, reliability and stability of the power distribution system, and truly achieve the goal of unattended.
3) Field device layer
The field device layer is a data acquisition terminal, which is mainly composed of a smart meter and an integrated protection device. The smart meter is connected to the communication server through a shielded twisted pair RS485 interface, and uses a MODBUS communication protocol bus type connection to reach the distribution room monitoring host via the communication server. Networking for remote control.
Smart meter field connection
The field instrument is connected by hand-shielded through the shielded twisted pair (RVVSP2*1.0). The number of smart meters connected to each bus is about 20, and then the data is uploaded to the serial port server NPORT5610-8 (16), and the data is uploaded. Go to the local monitoring terminal. The specific connection diagram is as follows:
The low-voltage incoming and feeder loops use multi-function meters that measure all conventional power parameters such as three-phase voltage, current, power factor, frequency, active energy, and reactive energy.
3 system function
Features
The system adopts full Chinese interface, and the operation is simple and convenient; the operation is stable and reliable; the system has a system diagram display, simulation diagram display and network structure diagram display; the system provides a friendly human-computer interaction interface, and all operations can be performed on the interface. And has a remote display function.
login interface
In order to ensure the safe and stable operation of the system, the user rights management function is set. Unauthorized operations (such as power distribution loop name modification, etc.) can be prevented by user rights management. Define the login name, password, and operation authority of users of different levels to provide reliable security for system operation and maintenance management. The user's level is divided into three levels: operator, engineer, and system administrator. Each level can be assigned to different operation rights, including entering operation, exiting operation, remote operation, and report management. The system administrator is the highest level user, and the higher level user can add and delete the next level of users.
The monitoring system interface is divided into three parts, the title interface, the power distribution system interface and the menu switching interface.
The current time of the currently logged in user and system is displayed in the title interface.
The system interface displays various parameters corresponding to the current interface.
The buttons arranged on the menu switching interface are the function switching buttons of the system. Different function buttons can enter the corresponding function interface.
High pressure system monitoring
High voltage system monitoring interface
The three-phase voltage, current and power isoelectric parameters under high voltage conditions can be observed through the interface. There are “close†and “open†buttons on the interface. If it is in the "closed" state, the closing button is prohibited. At this time, if you need to open the door, click the "open" button, enter the password, you can open the door remotely. If it is in the "open" state, the opening button is prohibited. At this time, if you need to close the switch, click the “Close†button and enter the password to open the switch remotely.
Low voltage system monitoring
Low voltage switching window
Low pressure system diagram
This interface can observe the real-time running status of the incoming cabinet and each outlet cabinet.
Detailed parameter interface
In the "Detailed Parameters" window, you can view the distribution and connection of each distribution circuit as well as the main electrical parameters. The main data includes: three-phase current, three-phase voltage, power of the incoming loop, power, power factor, circuit name, and current and circuit name of the outgoing loop.
When you choose to log in to the system as “Administratorâ€, you can click the loop name in the system map to modify the loop name directly. After the modification, the system will automatically save it. In the system diagram, the on/off of each loop will be indicated by a red-green switch. Red indicates that the loop is on and green indicates that the loop is open.
Communication status
The real-time display of the communication status of each device in the access system can completely display the entire system network structure, and can diagnose the network communication status of the system online. When a network failure occurs, the fault unit and the fault location can be automatically displayed on the screen. Therefore, the system maintenance personnel can grasp the communication status of each device in the real-time, and timely maintain the abnormal equipment to ensure the stable operation of the system.
Communication status map
This interface is the communication state of the high voltage circuit diagram. Click on the "to 1# substation" and to the "2# substation" arrow to enter the substation low voltage system. At the same time, you can see the distributed network structure. If the loop communication is normal, it will be red, otherwise it will be green.
Electrical parameter report
Real-time power parameters and historical power parameters storage and management functions, all real-time data collected, sequential event records, etc. can be saved to the real-time database. In the monitoring screen, you can customize the parameters that need to be queried, the time period of the query, or select the number of records that have been updated recently, and display them in a report mode. This feature makes it easy for users to conduct accident tracking queries.
Electric parameter report function
Set the time you need to query, click the Query button to query the electrical parameter report of each loop at a certain time in history. The main data includes: three-phase voltage, three-phase current, active power, reactive power, power compensation factor, and electrical energy.
This report contains all the loops. Help users to understand whether voltage instability, current limit, power and power factor meet the requirements during system operation. Based on this, the system is better managed and optimized.
Reports can be exported as a spreadsheet with print capabilities. Click Print Report to print the report as needed.
Energy report
The integrity of the measurement system is reflected in a rich data report. The system has the function of counting and counting the periodic meter reading of each loop. The user can freely query the power consumption of each power distribution node in any time period since the normal operation of the system, that is, the statistical analysis of the power consumption of the incoming line of the node and the power consumption of each branch circuit. Report. This function makes the electricity use visible and transparent, and can be traced when the power consumption error is too large to maintain the correctness of the measurement system.
Energy report function
The management of power consumption is presented in the form of a report. The report can display the power consumption of each loop in any period of time during the system operation. Each incoming loop and its outgoing loop are made in a table, which is convenient for querying. .
By adjusting the start time and end time, you can display the power consumption during this time period.
The report can be exported as a spreadsheet with print capabilities.
Current curve
A current potential curve is designed for the total incoming line of the distribution system (or the exit of the critical load). It is convenient for distribution and maintenance personnel to keep abreast of the demand of power consumption and the load of power supply system to ensure the reliability of power supply and provide guarantee for the energy use rights of user units. With this function, it is also possible to analyze the growth trend of energy demand, adjust the demand declaration in a timely manner, and reduce the excess payment due to excessive deviation of demand.
Current curve function
The X axis of the curve chart represents the time span, the Y axis represents the range, and the corresponding loop refresh curve is selected to display the historical curve display of the selected circuit for one day and seven days;
The current curve helps the user to perform power quality analysis and fault analysis.
Alarms and events
Real-time alarm
The real-time alarm window monitors the telemetry collected by the system. The alarm window opens automatically when the system is running and remains hidden in the background.
When there is current or voltage limit and the alarm limit is reached, the “Real-time real-time alarm†window will pop up automatically, and the specific alarm information will be displayed in red font: loop name, over-limit electric parameter, alarm value, etc.
Historical alarm
By adjusting the start time and end time, you can query the system alarm information in any past time period, including telemetry alarm and remote alarm, including the specific alarm time, alarm type, alarm content and so on.
System event
System event query function
In this interface, select “Real-time events†to view the operation status of each part of the system in the current state, and select “Event Query†to query the operation at any time.
High-pressure light plate
With high-voltage loop light card display function. This function can display the status of the on-site circuit breaker, grounding knife, circuit breaker trolley and related faults and alarm signals in real time, so that the distribution maintenance personnel can grasp the working status of the power distribution system in time.
High-pressure light plate
4 Conclusion
In today's power distribution facilities, the distribution security of the substation is of vital importance. The application of the Acrel-2000 power monitoring system described in this paper at No. 200 Tianlin Road can realize the power supply to the substation power supply and distribution circuit. The real-time monitoring can not only display the power consumption of the loop, but also have the network communication function, and can form a power monitoring system with the serial port server and the computer. The system realizes the analysis and processing of the collected data, displays the running status of each distribution circuit in the substation in real time, and has a pop-up alarm dialog box, voice prompt, SMS alarm light for the closing and closing of the load, and generates various energy reports. Analyze curves, graphs, etc., to facilitate remote meter reading and analysis and research of electric energy. The system is safe, reliable and stable, providing a real and reliable basis for the factory to solve the problem of electricity consumption, and has achieved good business benefits.
references:
[1]. Ren Zhicheng Zhou Zhong. Principles and Application Guidelines of Power Electrical Measurement Digital Instrumentation [M]. Beijing. China Electric Power Press. 2007. 4
[2]. Zhou Zhongbian. Smart grid customer power monitoring and power management system product selection and solution [M]. Beijing. Mechanical Industry Press. 2011.10
About the author: Yang Junjun, female, undergraduate. Position: Now working for Ankerui Electric Co., Ltd., contact number, mobile phone, QQ
Http://news.chinawj.com.cn Editor: (Hardware Business Network Information Center) http://news.chinawj.com.cn
Modular Container House,Storage Container Homes,Luxury Container Homes,Container House Near Me
Suzhou Daxiang Container House Co, Ltd , https://www.dx-house.com